E1. Transportation Inventory Results
1. Transportation Summary
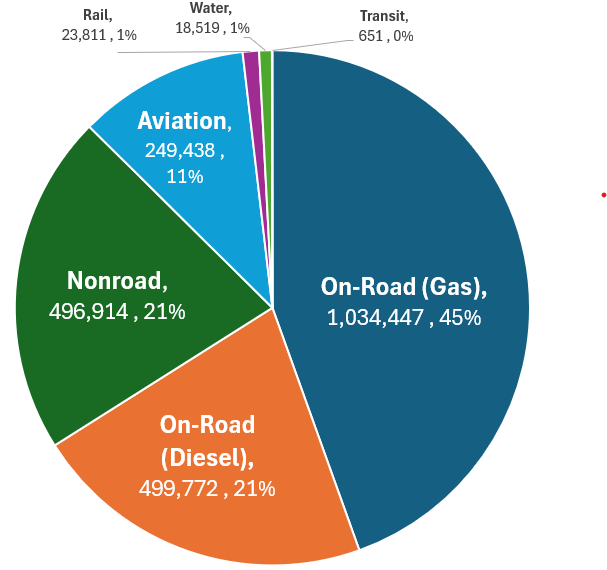
The Transportation sector causes 2.32 MMT of CO2e, or 37% of emissions in Washoe County. It is the largest USCP emissions sector. On-road vehicles cause 45% of the County’s transportation emissions, followed by nonroad—primarily construction vehicles—that cause 21% of the emissions. Aviation causes 11% of emissions. Rail (1%) and Water (1%) are responsible for the remainder, with a negligible amount of emissions (651 MT CO2e) coming from Transit.
Washoe County Transportation Sector Emissions, 2021 (MMT CO2e)
|
Washoe County Transportation Sector Emissions, 2021 |
|||
|
Category |
MMT CO2e |
MT CO2e |
% CO2e |
|
On-Road (Gas) |
1.03 |
1,034,447 |
45% |
|
On-Road (Diesel) |
0.50 |
499,772 |
22% |
|
Nonroad |
0.50 |
496,914 |
21% |
|
Aviation |
0.25 |
249,432 |
11% |
|
Rail |
0.02 |
23,811 |
1% |
|
Water |
0.02 |
18,519 |
1% |
|
Transit |
0.00 |
651 |
0% |
|
TOTAL |
2.32 |
2,323,551 |
100% |
2. On Road Transportation (USCP Required)
1.53 MMT of CO2e | 67% of Transportation Emissions | 25% of overall emissions
Sources of MT CO2e for On Road Transportation

|
Sources of MT CO2e for On Road Transportation |
||
|
Fuel |
MT CO2e |
Percent of On Road |
|
Gasoline |
1,034,447 |
67% |
|
Diesel |
499,772 |
33% |
|
TOTAL |
1,534,219 |
100% |
Definition: “On-road vehicles are designed for transporting people, property or material on common or public roads, thoroughfares, or highways. This category includes vehicles such as buses, cars, trucks, motorcycles, on-road waste collection and transportation vehicles (e.g. compactor trucks), etc. Most vehicles burn liquid or gaseous fuel in internal combustion engines. The combustion of these fuels produces CO2, CH4, and N2O, often referred to collectively as tailpipe emissions. Increasingly, electric or hybrid vehicles can also be charged at stations within or outside the city.”
Roads in Washoe County Washoe County has more than 5,700 lane miles of roads, grouped into three categories. First, the Nevada Department of Transportation (NDOT) manages approximately 1,396 lane miles of state roads in Washoe County, including two Interstate Routes (I-80, I-580), two US Routes (US 395, US 395A), and 16 State Routes. Second, the Regional Transportation Commission (RTC) and the local jurisdictions share responsibility for approximately 1,047 lane miles of the Regional Road Network. This includes 662 lane miles in Reno, 254 lane miles in Sparks, and 131 lane miles in Unincorporated Washoe County. Third, local jurisdictions manage approximately 3,293 lane miles of Local Roads, which are all roads other than state roads, regional roads, and private roads that are located within the local jurisdictions. There are 1,061 lane miles in Reno, 484 lane miles in Sparks, and 1,631 lane miles in Unincorporated Washoe County.
GHG Inventory Methodology Vehicle Miles Traveled (VMT) information comes from Google’s Environmental Insights Explorer (EIE) tool. This tool provides In-Boundary, Inbound, and Outbound VMT. In-Boundary trips begin and end within Washoe County. Inbound trips begin outside of Washoe County and end inside Washoe County. Outbound trips begin inside Washoe County and end outside Washoe County. “GPC Distance” represents an Origin-Destination VMT Model, compliant with the Global Protocol for Community-Scale Greenhouse Gas Inventories (GPC). The values represent 100% of all in-boundary transportation and 50% cross-boundary transportation (inbound and outbound).
The inventory data does not include trips that pass through—but do not stop in—Washoe County. Although these trips are not included in the GPC protocol, they, too, contribute to emissions, and are included in other government agency calculations related to emissions. For reference, the NV Department of Transportation (DOT) calculated 3,988,225,465 total vehicle miles traveled (VMT) using a different methodology. This number is 32% higher than the VMT number used for the calculation in this inventory, 3,025,816,742 VMT.
|
2021 Vehicle Miles Traveled in Washoe County |
|||||
|
travel_bounds |
trips |
full_distance_km |
gpc_distance_km |
distance (miles) |
% miles |
|
IN-BOUNDARY |
381,146,498 |
2,918,510,126 |
2,918,510,126 |
1,813,478,110 |
60% |
|
INBOUND |
24,904,503 |
1,958,397,072 |
979,198,536 |
608,445,760 |
20% |
|
OUTBOUND |
24,799,551 |
1,943,742,748 |
971,871,374 |
603,892,872 |
20% |
|
TOTAL |
430,850,552 |
6,820,649,946 |
4,869,580,036 |
3,025,816,742 |
100% |
The inventory then uses the National Default Vehicle Mix to designate VMT by vehicle type and fuel type. ICLEI gets this mix from the EPA’s State Inventory and Projection tool. The dataset does not specifically include Electric Vehicles (EVs) or nonstandard fuels. For this inventory, we did not manually enter EV estimates, as the number of EVs in Washoe County is not easily accessible, and even the number of EVs statewide was only 17,400 vehicles, or 0.70% of the 2.4M vehicles registered in the entire state of Nevada. In this inventory, we assume that energy use for charging electric vehicles is included in residential and commercial energy calculations. And we expect the technology for tracking and calculating electric vehicle and nonstandard fuel use will improve in future inventories as vehicles that use these technologies become more prevalent.
|
National Vehicle Mix – Vehicle Types |
||
|
Fuel Type |
Gas |
Diesel |
|
% Passenger |
75% |
4% |
|
% Light-Duty |
24% |
8% |
|
% Heavy-Duty |
0% |
88% |
|
% Motorcycle |
1% |
0% |
The National Default Vehicle Mix also indicates the percent of VMT traveled by gas (88.5%) and diesel (11.50%) vehicles. Of the 3,025,815, 817 VMT traveled in Washoe County in 2021, drivers traveled 2,677,846,998 miles in gasoline vehicles, and 347,968,819 miles in diesel vehicles.
|
National Vehicle Mix - VMT by fuel |
||
|
Fuel Type |
Washoe County VMT |
VMT % |
|
Gas |
2,677,846,998 |
88.50% |
|
Diesel |
347,968,819 |
11.50% |
|
Total |
3,025,815,817 |
100% |
Finally, the inventory applies the 2021 US National Defaults factor set (updated 2023) to the trip data to calculate emissions. This factor set comes from the EPA.
|
2021 US National Defaults (updated 2023) - fuel efficiency |
|||
|
Vehicle Type |
Fuel Economy (MPG) |
g CH4 / mi |
g N2O / mi |
|
Gas Passenger Vehicle |
25.3 |
0.0084 |
0.0069 |
|
Gas Light Truck |
18.2 |
0.0117 |
0.0087 |
|
Gas Heavy Truck |
5.383557 |
0.0719 |
0.0611 |
|
Gas Transit Bus |
18.2 |
0.0117 |
0.0087 |
|
Gas Para Transit Bus |
18.2 |
0.0117 |
0.0087 |
|
Gas Motorcycle |
44 |
0.0084 |
0.0069 |
|
Electric Vehicle |
n/a |
n/a |
n/a |
|
Diesel Passenger Vehicle |
25.3 |
0.0005 |
0.001 |
|
Diesel Light Truck |
18.2 |
0.001 |
0.0015 |
|
Diesel Heavy Truck |
6.561615 |
0.0051 |
0.0048 |
|
Diesel Transit Bus |
18.2 |
0.001 |
0.0015 |
|
Diesel Para Transit Bus |
18.2 |
0.001 |
0.0015 |
|
Diesel Motorcycle |
44 |
0.0005 |
0.001 |
3. Nonroad Vehicles (USCP Recommended)
0.50 MMT of CO2e | 21% of Transportation Emissions | 8% of overall emissions
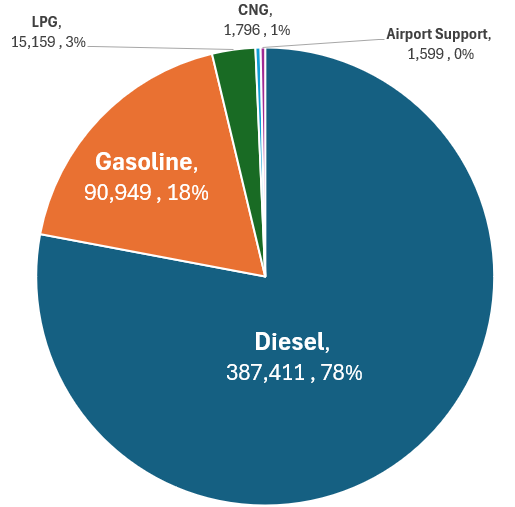
Sources of MT CO2e for Nonroad Transportation
|
Sources of MT CO2e for Nonroad Transportation |
||
|
Fuel |
MT CO2e |
Percent of Non-Road |
|
Diesel |
387,411 |
78% |
|
Gasoline |
91,009 |
18% |
|
LPG |
15,159 |
3% |
| CNG | 1,796 | 1% |
|
Airport Support |
1,599 |
0% |
|
TOTAL |
496,914 |
100% |
Definition: “Off-road vehicles are those designed or adapted for travel on unpaved terrain. This category typically includes all-terrain vehicles, landscaping and construction equipment, tractors, bulldozers, amphibious vehicles, snowmobiles and other off-road recreational vehicles…Emissions from off-road transportation activities within transportation facility premises such as airports, harbors, bus terminals, and train stations” are also included.
Nonroad Vehicles in Washoe County Almost all of the diesel emissions in Washoe County come from construction equipment. The remainder of all fuel use comes from commercial equipment, industrial equipment, lawn & garden equipment, and recreational equipment.
Methodology The inventory utilizes “mobile nonroad” data from the EPA’s National Emissions Inventory (see Appendix 6 for data description). The NEI provides carbon dioxide (CO2), methane (CH4), and nitrous oxide (N2O) emissions for off-highway vehicle diesel, gasoline, liquefied petroleum gas (LPG), and compressed natural gas (CNG). The Clearpath software applies global warming potentials for methane and nitrous oxide are applied, then emissions are summed with CO2 to produce CO2e values.
|
Non-road emissions (tons) from EPA’s NEI data |
|||
|
Fuel Type |
Carbon Dioxide (CO2) |
Methane (CH4) |
Nitrous Oxide (N2O) |
|
Mobile - Nonroad Equipment - Diesel |
426,827.20 |
7.87 |
N/A |
|
Mobile - Nonroad Equipment - Gasoline |
98,001.02 |
82.85 |
N/A |
|
Mobile - Nonroad Equipment - LPG |
16,678.82 |
1.10 |
N/A |
|
Mobile - Nonroad Equipment - CNG |
1,664.01 |
11.61 |
N/A |
4. Aviation Travel (USCP Recommended)
0.25 MMT of CO2e | 11% of Transportation Emissions | 4% of overall emissions
Sources of MT CO2E from Aviation

|
Sources of MT CO2E from Aviation |
|||
|
Location, Use |
Fuel |
MT CO2e |
Percent |
|
RTIA, Commercial |
Jet-A |
146,241 |
59% |
|
RTIA, Freight |
Jet-A |
48,196 |
19% |
|
RTIA, Gen Aviation |
Jet-A |
39,861 |
16% |
|
RTIA, Gen Aviation |
AvGas |
1,294 |
1% |
|
Reno-Stead, Gen A |
Jet-A |
4,776 |
2% |
|
Reno-Stead, Gen A |
AvGas |
831 |
0% |
|
RTIA – ANG |
Jet-A |
8,238 |
3% |
|
TOTAL |
- |
249,441 |
100% |
Definition: “Civil aviation, or air travel, includes emissions from airborne trips occurring within the geographic boundary (e.g., helicopters operating within the city) and emissions from flights departing airports that serve the city.”
Aviation in Washoe County
Reno-Tahoe International Airport (RTIA; airport code RNO), located 4 miles southeast of Reno’s central business district, is the primary airport that serves Washoe County. As defined by the Federal Aviation Administration, (FAA), RNO is a medium hub commercial airport. It served over 1.8M passengers across 11 different airlines in calendar year 2021 and was the 63rd busiest commercial airport in the United States. In 2022, commercial cargo carriers FedEx, United Parcel Service (UPS), and DHL transported more than 147 million pounds of air cargo through RNO. General aviation flights also operate out of RNO, including Flight School, small aircraft, and helicopter operations.
Reno-Stead Airport (RTS) is a general aviation facility located 11 miles northwest of the central business district that is home to approximately 200-based aircraft. Hundreds of aircraft also utilized RTS for the Reno Air Races, an air racing and air show event held from September 15 – 19, 2021. The Reno Tahoe Airport Authority (RTAA) operates both RTIA and Reno-Stead.
Air National Guard (ANG) flights also operate out of both RTIA and RTS. This inventory includes data for ANG operations at RTIA, but the Reno-Stead ANG had not provided 2021 data before this inventory was published.
We also did not receive data from Spanish Springs Airport. Data from both the Reno-Stead ANG and Spanish Springs Airport should be included in future inventories.
Methodology The inventory calculates emissions related to the amount of fuel loading that takes place within Washoe County. “Jet A” jet fuel is the most commonly used fuel for commercial (passenger) and freight aviation. “AvGas,” or aviation gas, is frequently used in general aviation. The USCP recommends separating international flights from domestic flights. However, RTIA has only one daily international flight to Guadalajara, Mexico, and the fuel for those flights is included in the domestic total since total fuel use is small.
|
2021 Fuel Use by Aviation Type |
|||
|
Airport |
Aviation Type |
Fuel Type |
Gallons of Fuel |
|
RTIA |
Commercial (Passenger) |
Jet Kerosene |
14,948,972 |
|
RTIA |
Freight |
Jet Kerosene |
4,926,489 |
|
RTIA |
General Aviation |
Jet Kerosene |
4,074,471 |
|
RTIA |
General Aviation |
Aviation Gasoline |
155,118 |
|
Reno-Stead |
General Aviation |
Jet Kerosene |
488,146 |
|
Reno-Stead |
General Aviation |
Aviation Gasoline |
99,619 |
|
ANG - RTIA |
ANG |
Jet Kerosene |
842,075 |
|
ANG - Reno-Stead |
ANG |
Jet Kerosene |
not received |
|
TOTAL |
|
|
10,585,918 |
This inventory applies emissions factors to the gallons of fuel that are filled in Washoe County. Jet A is more emissions-intensive than AvGas, per the table below.
|
Emissions Factors for Aviation |
||
|
Greenhouse Gas |
Jet A |
AvGas |
|
CO2 (kg / gallon) |
9.75 |
8.31 |
|
CH4 (g / gallon) |
0.41 |
0.36 |
|
N2O (g / gallon) |
0.08 |
0.07 |
5. Rail Transportation (USCP Recommended)
0.02 MMT of CO2e | 1% of Transportation Emissions | <1% of overall emissions
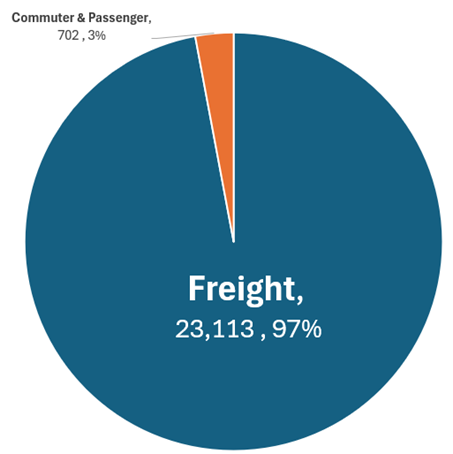
Sources of MT CO2e from Rail Transportation
|
Sources of MT CO2e from Rail Transportation |
||
|
Rail Type |
MT CO2e |
Percent |
|
Freight |
23,113 |
97% |
|
Commuter & Passenger |
702 |
3% |
|
Total |
23,815 |
100% |
Definition: Railways can be used to transport people and goods, and are powered by a locomotive, which typically uses energy through combustion of diesel fuels or electricity (known as electric traction).
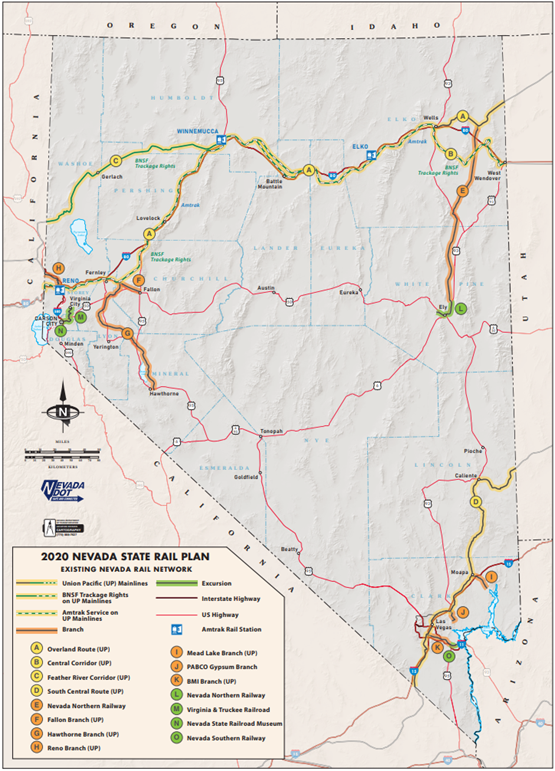
Rail in Washoe County According to the 2021 Nevada State Rail Plan, the Union Pacific Railroad (UPRR) operates east-west rail corridors in both northern and southern Nevada. BNSF Railway (BNSF) has trackage rights on nearly three-quarters of UPRR’s Nevada trackage. The two-route northern Nevada corridor serves Reno and connects with Salt Lake City and Denver to the east and with Sacramento and the San Francisco area to the west. Amtrak operates once-a-day passenger rail service in each direction across this northern Nevada corridor; I-80 generally parallels the rail lines in this corridor. See Figure 4 for a map of the Nevada State rail network.
2020 Nevada State Rail Plan: Existing Nevada Rail Network
Methodology The inventory utilizes “mobile nonroad” data from the EPA’s National Emissions Inventory (see Appendix 6 for data description). The NEI provides carbon dioxide (CO2), methane (CH4), and nitrous oxide (N2O) emissions for line-haul locomotives, both Class I + Class II/III Operations (freight) and Commuter Lines and Passenger Trains. The Clearpath software applies global warming potentials for methane and nitrous oxide, then emissions are summed with CO2 to produce CO2e values.
|
Rail emissions (tons) from EPA’s NEI data |
|||
|
Rail Type |
Carbon Dioxide (CO2) |
Methane (CH4) |
Nitrous Oxide (N2O) |
|
Mobile - Locomotives - Class I/II/III Operations (Freight) |
25,265.23 |
1.83 |
0.59 |
|
Mobile - Locomotives - Passenger Trains (Amtrak) |
724.38 |
0.05 |
0.02 |
|
Mobile - Locomotives - Commuter |
n/a |
n/a |
n/a |
6. Water Transportation (USCP Recommended)
0.02 MMT of CO2e | 0.8% of Transportation Emissions | <1% of overall emissions
Sources of MT CO2e from Water Transportation
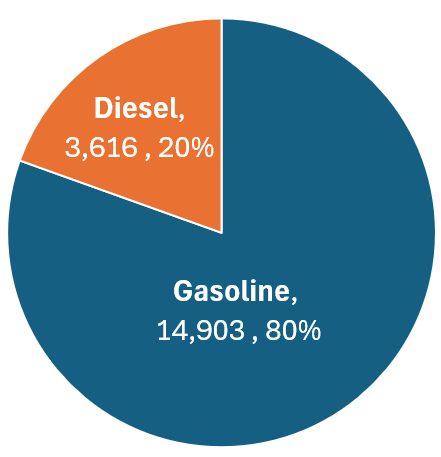
|
Sources of MT CO2e from Water Transportation |
||
|
Fuel Type |
MT CO2e |
Percent |
|
Gasoline |
13,903 |
80% |
|
Diesel |
3,616 |
20% |
|
Total |
18,519 |
100% |
Definition: Water transportation includes ships, ferries, and other boats operating within the city boundary, as well as marine-vessels whose journeys originate or end at ports within the city’s boundary but travel to destinations outside of the city.
Water Transportation in Washoe County Washoe County is land-locked, so it has no emissions from commercial marine vessels. Emissions come from gasoline and diesel fueling of pleasure craft that are operated on one of the County’s 50 lakes. The largest lakes in the county include 125,000-acre Pyramid Lake, which is fully within Nevada’s boundary, and 193-square-mile Lake Tahoe, whose northeast corner is in Washoe County. The southeast shores of Lake Tahoe touch Carson City and Douglas County, Nevada, and the western and southern shores are in Placer and El Dorado Counties, California.
Methodology The inventory utilizes “mobile nonroad” data from the EPA’s National Emissions Inventory (see Appendix 6 for data description). The NEI provides carbon dioxide (CO2), methane (CH4), and nitrous oxide (N2O) emissions for both gasoline and diesel-powered mobile pleasure craft. The Clearpath software applies global warming potentials for methane and nitrous oxide, then emissions are summed with CO2 to produce CO2e values.
|
Water transportation emissions (tons) from EPA’s NEI data |
|||
|
Water Craft Type |
Carbon Dioxide (CO2) |
Methane (CH4) |
Nitrous Oxide (N2O) |
|
Mobile - Pleasure Craft -Gasoline |
16,015.91 |
15.15 |
N/A |
|
Mobile - Pleasure Craft - Diesel |
3,986.42 |
0.12 |
N/A |
|
Mobile - Commercial Marine Vessels |
- |
N/A |
N/A |
7. Public Transport (USCP Recommended)
0.001 MMT of CO2e | 0.03% of Transportation Emissions | <1% of overall emissions
Sources of MT CO2e from Public Transport

|
Sources of MT CO2e from Public Transport |
|||
|
Transit Type |
Fuel |
MT CO2e |
Percent |
|
Buses |
Electric |
338 |
52% |
|
Paratransit, Flexride |
Gasoline |
122 |
19% |
|
Paratransit, Flexride |
CNG |
118 |
18% |
|
Regional Connector to Carson City |
Electric |
72 |
11% |
|
Buses |
Biodiesel |
1 |
0% |
|
TOTAL |
- |
651 |
100% |
Definition: Public transport vehicles such as vans and buses are “on-road” vehicles. Data for public transport comes directly from the local transport operator, RTC Washoe, and thus is reported in a separate section of this inventory.
Public Transport in Washoe County Public Transport is managed by the Regional Transportation Commission (RTC) of Washoe County. RTC offers five types of service: RTC RIDE, RTC ACCESS, FlexRIDE On-Demand service, REGIONAL CONNECTOR, and Vanpool. See examples of vehicle types in Figures 5 and 6. RTC RIDE is a fixed route bus service in Reno and Sparks. In RTC’s fiscal year (FY) 2022 (July 2021 – June 2022), RTC RIDE had a fleet of 65 buses and 22 routes, including two bus rapid transit (BRT) routes, the Virgina Line and Lincoln Line. In calendar year 2021, customers took 4.4M rides on RTC RIDE. RTC ACCESS is a paratransit service that provides door-to-door, prescheduled transportation for people who meet the eligibility criteria of the Americans with Disabilities Act (ADA). In FY2022, RTC had 46 vans in the ACCESS fleet, and customers took 130,899 trips. FlexRIDE is curbside-to-curbside transit service available in select areas of Sparks / Spanish Springs, Somersett / Verdi, South Meadows, and North Valleys. In FY2022, Flexride delivered over 51,000 trips. The REGIONAL CONNECTOR is the intercity commuter service between Reno and Carson City, which has 5 stops and runs three morning and three afternoon round trips on weekdays. In calendar year 2021, customers took 14,890 trips on this service. Finally, RTC subsidizes vanpool, which is a transportation alternative for groups of 4 to 14 people who share similar commute patterns. A commuter van is driven by one of the members of the group and passengers are picked up and dropped off at agreed upon locations and times.
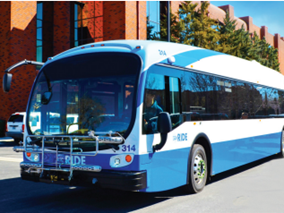
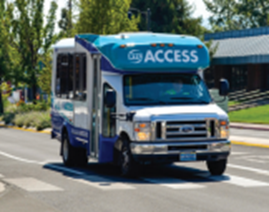
Figure 5 RTC RIDE and Regional Connector Figure 6 RTC ACCESS and FlexRIDE
Methodology: RTC RIDE buses and the Regional Connector bus to Carson City started running on 100% alternative fuels as of 2021. The Carson City Regional Connector was electric, and the RTC RIDE fleet was a combination of one-third electric buses and two-thirds hybrid electric / biodiesel buses, capable of running 35% of the time in all-electric mode. RTC added 17 new hybrid buses to its fleet in February 2021. RTC ACCESS and Flexride vehicles use either gasoline or compressed natural gas (CNG).
The inventory uses NV Energy’s 2021 grid emissions factor to calculate emissions for electric vehicles. See section E2, Energy Emissions to learn more about this approach. To calculate the GHG impact of bio-diesel, gasoline, or compressed natural gas (CNG) the inventory uses the 2021 US National Defaults (updated 2023).
The table below shows energy use by fuel type for RTC RIDE and the Regional Connector.
|
Energy Use by Fuel Type for RTC Washoe’s services, 2021 |
||||
|
Vehicle |
Fuel Type |
Fuel |
Unit |
MT Co2e |
|
Buses |
Electric |
1,020,784 |
kWh |
338 |
|
Regional Connector |
Electric |
250,159 |
kWh |
118 |
|
Buses |
Biodiesel |
568,890 |
Gallons |
1 |
|
ACCESS, FLEXride |
CNG |
179,175 |
Gallons |
118 |
|
ACCESS, FLEXride |
Gasoline |
13,504 |
Gallons |
122 |
|
TOTAL |
Electric |
1,270,943 |
kWh |
456 |
|
TOTAL |
Biodiesel |
568,890 |
Gallons |
1 |
|
TOTAL |
CNG |
179,175 |
Gallons |
118 |
|
TOTAL |
Gasoline |
13,504 |
Gallons |
122 |
And finally, RTC Washoe reported 196,038 gallons of gasoline used for its vanpool. Using the National Default factor sets for fuel, this program creates 1,721 MT CO2e, the largest source of emissions for an RTC-managed program. However, the vanpool passenger van trips are included in Google’s EIE “On Road” data, described above, so these emissions are not included as part of the Public Transit emissions.
