E9. Agriculture, Forestry, and Other Land Use (AFOLU) Inventory Results
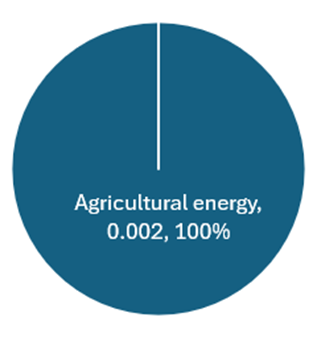
The AFOLU sector causes 0.002 MMT of CO2e, less than 1% of emissions in Washoe County. Of the “Required” emissions categories in the USCP Inventory standard, 100% of the emissions come from electricity that powers agricultural businesses.
MT CO2e for Agricultural Emissions in Washoe County

Definition Emissions and removals from the Agriculture, Forestry and Other Land Use (AFOLU) sector are produced through a variety of pathways, including livestock (enteric fermentation and manure management), land use and land use change (e.g., forested land being cleared for cropland or settlements), and aggregate sources and non-CO2 emissions sources on land (e.g., fertilizer application and rice cultivation).
Agriculture, Forestry, and Land Use (AFOLU) Methodology
The ICLEI US Community Protocol (USCP) suggests 5 types of AFOLU data: 1) emissions from energy use 2) emissions and removals from forests, 3) emissions and removals from trees outside of forests, 4) emissions from livestock, and 5) emissions from crop agriculture.
Emissions from energy use are included in this inventory. The USCP requests agricultural energy use to be in the AFOLU category instead of “Commercial” or “Industrial” energy. Both NV Energy and Plumas Sierra Rural Electric Company (PSREC) supply energy to agricultural customers, and that energy use is included in the AFOLU sector, using the same energy methodology and factor sets explained in section E2, Energy Methodology.
USCP says data types 2 and 3 are “Recommended.” This inventory calculates these figures using ICLEI’s Land Emissions and Removals Navigator (LEARN) tool. A longer discussion of trees and forests is included in the next section. The USCP standard calls for a “gross” GHG emissions calculation that does not include the “net” impact of sequestration (removal of CO2 from the atmosphere). So both emissions and removals from land use are described below, but neither emissions nor removals are included in the final GHG count for Washoe County.
Data types 4 and 5 are USCP “Optional.” This inventory does not calculate emissions from livestock (data type 4) because these emissions were small in the 2014 inventory (0.0281MMT CO2e). Similar emissions in 2021 would account for less than 1% of the total 2021 GHG emissions in Washoe County. We assume the livestock figures did not change much between 2014 and 2021. The inventory also does not calculate data from crop agriculture (data type 5). Out of 1,693,762 hectares of land in Washoe County, only 2,187 hectares—less than 1% of total land—is cropland. The previous 2014 inventory also did not calculate emissions from cropland.
Trees, Forests, and Land Use in Washoe County
Unlike other sectors, different types of land use not only emit GHGs, but they can also remove CO2 from the atmosphere through photosynthesis, the process by which plants convert light energy into the chemical energy necessary to help them grow. Forests and trees play a key role in regulating the planet’s climate.
ICLEI’s proprietary LEARN tool uses point-in time data from the US Geological Survey’s (USGS) National Land Cover Database (NLCD) to provide snapshots of estimated land use emissions and removals data by calculating land cover changes between 2013 and 2019.
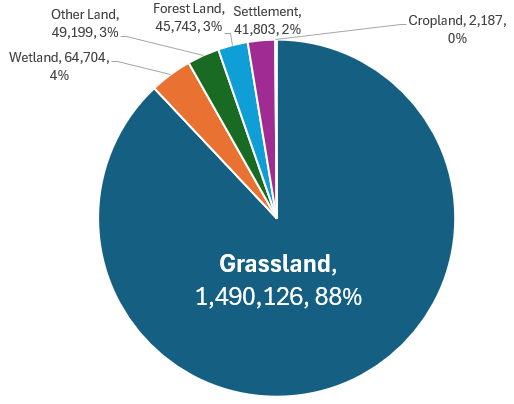
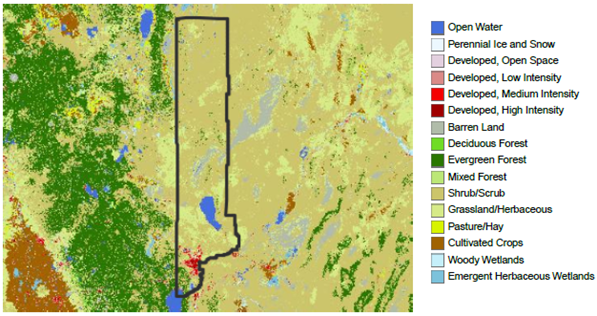
Grassland is, by far, the most common land use type in Washoe County. In 2019, grassland covered 1,490,126 hectares, or 88% of Washoe County. See a map of land use types in Figure 14.
Land cover (hectares) in Washoe County from the National Land Cover Database, 2019

Land Cover Subcategories, with 2019 size in hectares (ha):
Grassland (1,490,126 ha)
|
Shrub, scrub |
Grassland / herbaceous (herbs) |
Pasture / hay |
|
1,214,376 |
274,039 |
1,712 |
Wetland (64,704 ha)
|
Open water |
Emergent herbaceous wetlands |
|
58,021 |
6,683 |
Other Land (49,199 ha)
|
Barren land |
Perennial ice / snow |
|
6,817 |
0 |
Forest Land (45,743 ha)
|
Evergreen forest |
Woody wetlands |
Mixed forest |
Deciduous (sheds leaves yearly) |
|
38,923 |
5,157 |
1,443 |
220 |
Settlement / Developed (41,803 ha)
|
Medium intensity |
Low intensity |
Open space |
High intensity |
|
14,108 |
13,331 |
7,547 |
6,817 |
Cropland (2,187 ha)
|
Cultivated crops |
|
2,187 |
 Land cover in Washoe County from the National Land Cover Database, 2019
Some modest changes in land use occurred between 2013 and 2019, and the inventory uses these land use changes to calculate GHG emissions and removals. See Appendix 10 for a full land use change matrix.
|
GHG Emissions and Removals from Land Use changes, 2013 to 2019 |
|||||
|
Type |
Land Use |
2013 to 2019 value (ha) |
removals factor |
emissions factor |
annual GHG emissions (MT CO2e/yr) |
|
Forest Change |
"forest to..." |
1,469 |
- |
- |
18,410 |
|
Deforestation |
to grassland |
605 |
- |
41 |
15,352 |
|
Deforestation |
to other |
6 |
- |
37 |
1,245 |
|
Deforestation |
to wetland |
798 |
- |
2 |
1,112 |
|
Deforestation |
to settlement |
60 |
- |
19 |
701 |
|
Deforestation |
to cropland |
0 |
- |
4 |
0 |
|
Reforestation |
- |
2,469 |
- |
- |
-2,913 |
|
- |
non-forest to forest |
2,469 |
-0.32 |
- |
-2,913 |
|
Forest - Remaining |
|
43,274 |
- |
- |
-20,476 |
|
Undisturbed |
- |
36,255 |
-0.23 |
- |
-31,046 |
|
Disturbed |
Total |
7,019 |
- |
- |
10,570 |
|
- |
Insect |
6,734 |
- |
29.01 |
- |
|
- |
Harvest / Other |
190 |
- |
0.62 |
- |
|
- |
Fire |
95 |
- |
54.51 |
- |
|
Trees Outside of Forest |
- |
4,433 |
- |
- |
-42,837 |
|
Tree canopy loss |
- |
9 |
- |
78.2 |
523 |
|
Canopy maintained / gained |
- |
4,433 |
-2.66 |
- |
-43,360 |
|
GHG Emissions |
- |
- |
- |
- |
29,503 |
|
GHG Removals |
- |
- |
- |
- |
-77,319 |
|
Net GHG Balance |
- |
- |
- |
- |
-47,816 |
On net, between 2013 – 2019, forests and trees removed more emissions (-77,319 MT CO2e / year) than were caused by land use changes (29,503 MT CO2e / year). More land was reforested (2,469 ha) than deforested (1,469 ha). Most of the reforestation came from grassland to forest (~2,400 ha), followed by wetland to forest (~100 ha). Most of the deforestation was from forest to wetland (~800 ha), and forest to grassland (~600 ha). Tree canopy loss was only 2 ha per year, with most of the loss going to grassland (~1.55 ha / year), followed by wetland (0.2 ha / year) and settlement (0.05 ha / year).
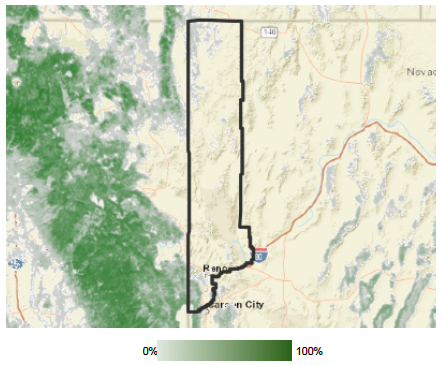
While forest data covers the time period 2013 – 2019 in the NLCD, tree canopy data captures 2011 – 2016. Over this time period, Washoe County had an average of 4,442 ha of tree canopy outside of forests, representing nearly 0.3% tree canopy in these areas. An image of Washoe County’s 2016 tree canopy is below.

Total GHG emissions for Washoe County across all sectors could be reduced if additional forests / trees are added to its land base, and / or if tree losses are reduced further.
