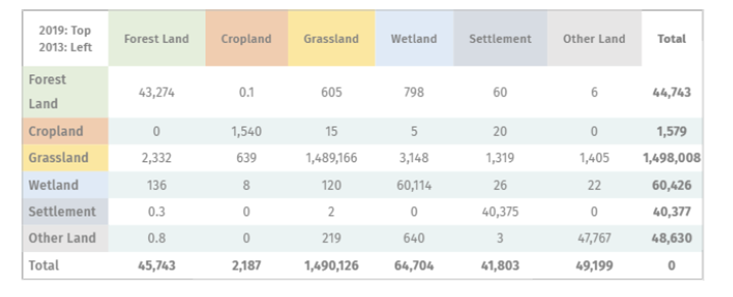
Appendix 10: Land Use Change Matrix, 2013 - 2019
Simplified land cover change matrix for 2013 to 2019. All areas in hectares.

|
Simplified land cover change matrix for 2013 to 2019. All areas are in hectares. |
|||||||
|
2019: Top |
Forest Land |
Cropland |
Grassland |
Wetland |
Settlement |
Other Land |
Total |
|
Forest Land |
43,274 |
0.1 |
605 |
798 |
60 |
6 |
44,743 |
|
Cropland |
0 |
1,540 |
15 |
5 |
20 |
0 |
1,579 |
|
Grassland |
2,332 |
639 |
1,489,166 |
3,148 |
1,319 |
1,405 |
1,498,008 |
|
Wetland |
136 |
8 |
120 |
60,114 |
26 |
22 |
60,426 |
|
Settlement |
0.3 |
0 |
2 |
0 |
40,375 |
0 |
40,377 |
|
Other Land |
0.8 |
0 |
219 |
640 |
3 |
47,767 |
48,630 |
|
Total |
45,743 |
2,187 |
1,490,126 |
64,704 |
41,803 |
49,199 |
0 |
