E2. Energy Methodology
1. Energy Summary
The Energy (Buildings) sector causes 3.58 MMT of CO2e, or 57% of emissions in Washoe County. When Commercial, Residential, and Industrial energy use are added together, Energy emissions from Buildings are the largest sector. Taken individually, as defined by the USCP, Commercial (22%), Residential (20%), and Industrial Energy (15%) are the second, third, and fourth largest sources, respectively, following Transportation (37%).
Within the Energy Category, 40% of emissions come from Commercial buildings, 34% comes from Residential buildings, and 26% come from Industrial buildings.
MT CO2e by Energy Sector
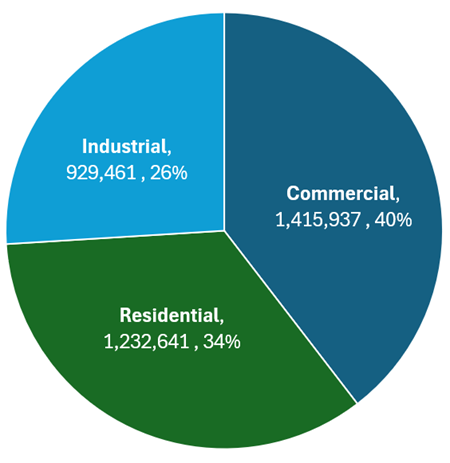
| Energy Emissions by Sector | ||
|
Sector |
MT CO2e |
% of total |
|
Commercial |
1,415,937 |
40% |
|
Residential |
1,232,641 |
34% |
|
Industrial |
929,461 |
26% |
|
TOTAL |
3,578,039 |
100% |
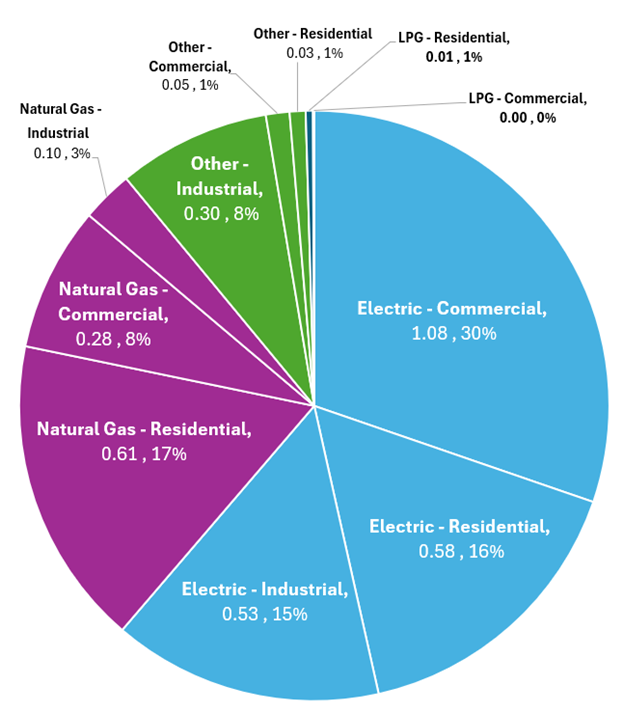
Sixty-one percent of the emissions from energy come from electric power, and 28% comes from natural gas, less than 1% comes from liquefied petroleum gas (LPG), and 11% comes from other fuel sources such as distillate fuel oil, hydrocarbon gas liquids (HGL), or wood.
MMT CO2e by Energy Type and Sector
|
Breakdown of energy use by type and sector in Washoe County, 2021 |
|||
|
Energy Type |
Sector |
MMT Co2e |
% of total |
|
Electric |
Commercial |
1.08 |
31% |
|
Electric |
Residential |
0.58 |
16% |
|
Electric |
Industrial |
0.53 |
15% |
|
Natural Gas |
Residential |
0.61 |
17% |
|
Natural Gas |
Commercial |
0.28 |
8% |
|
Other |
Industrial |
0.10 |
3% |
|
Other |
Commercial |
0.05 |
1% |
|
Other |
Residential |
0.03 |
1% |
| LPG |
Residential |
0.01 |
0% |
|
LPG |
Commercial |
0.00 |
0% |
|
TOTAL |
- |
3.58 |
100% |
2. Energy Providers in Washoe County
In Washoe County, NV Energy is the main provider of both electricity and natural gas. NV Energy serves 1.3 million statewide electric customers and 50 million tourists annually across a 45,703-square-mile service territory that stretches north to south across Nevada from Elko to Clark County. See Figure 7 for a map of the service area.
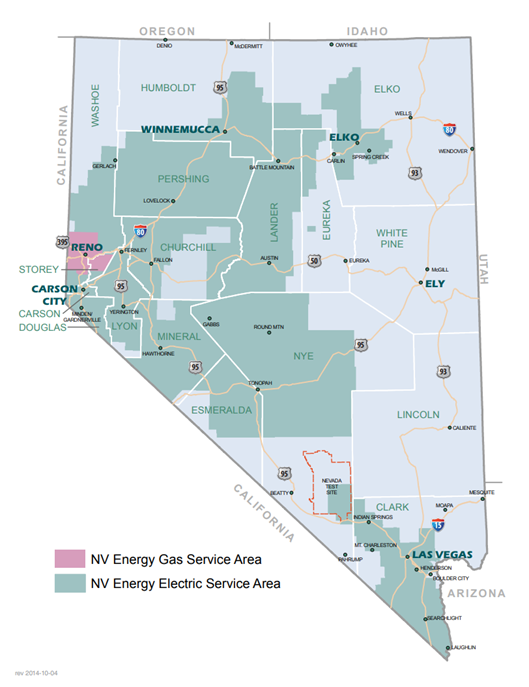
Figure 7: NV Energy's service area map
NV Energy provides electric power to Washoe County from four company-owned power plants in Northern Nevada: Clark Mountain Combustion Turbines (132 MW), Fort Churchill Generating Station (226 megawatts / MW), Frank A. Tracy Generating Station (753 MW), and North Valmy Generating Station (261 MW). North Valmy is a coal-fueled, steam-electric generating plant, and the other three are fueled by natural gas or, in some cases, diesel oil. As of 2023, NV Energy announced plans for North Valmy to switch to a natural gas plant by 2025. Together, NV Energy’s plants can produce more than 1,500 megawatts (MW) of electricity. As a reference point, one megawatt is equivalent to the power required to serve about 600 households. NV Energy relies on a combination of power generated at company-owned plants and electricity purchased from other utilities and independent power producers, including several geothermal, solar, and wind plants located in Nevada.
Southwest Gas provides natural gas to a small area in the Washoe Valley in the southern part of the County. Southwest Gas serves more than 2 million customers across Nevada, Arizona, and portions of California. See Figure 8.
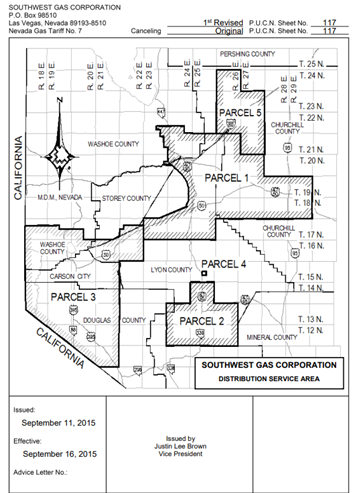
Figure 8: Southwest Gas service area map for Nevada
Finally, two electric cooperatives provide electricity to rural parts of the County. See a map of coverage areas in Figure 9.
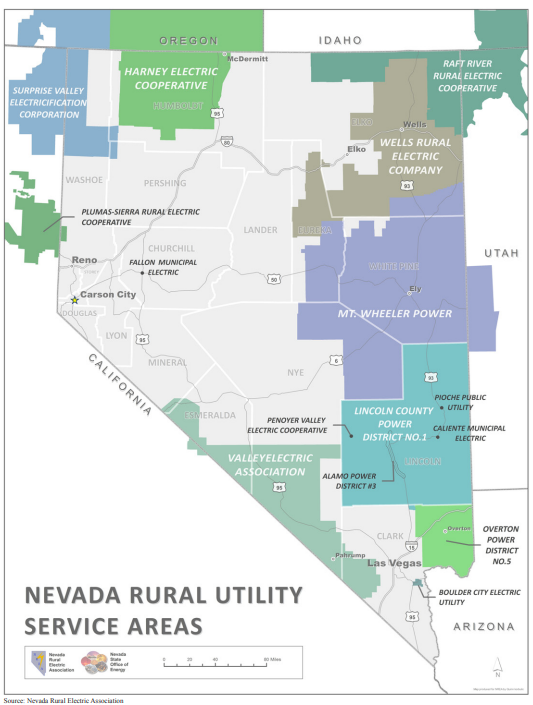
Figure 9: Public Utilties Commission (PUC) NV Rural Utility Service Areas Map
Surprise Valley Electrification Corporation (SVEC) serves rural Washoe County communities north of Gerlach, all the way north to the Oregon border and west to the California border. SVEC is a non-profit rural electric cooperative owned by those it serves. Individuals receiving electric service from Surprise Valley Electric are member owners of the cooperative. SVEC also serves communities in Nevada, Oregon, and California.
Plumas-Sierra Rural Electric Cooperative (PSREC) serves a small rural area just north of Cold Springs. PSREC is consumer-owned and not-for-profit. Any revenue beyond PSREC expenses is eventually returned to members in the form of capital credit payments. PSREC also serves three counties in California: Plumas, Sierra, and Lassen.
For definitions of customer types at four utilities, see Appendix 7.
3. Methodology for Energy Calculations
Electricity In its 2021 Sustainability Report, NV Energy reported an Emissions Intensity of .331 MT / Net MWh for its combined Owned Generation (electricity generated at NV Energy plants) and Purchased Power (electricity generated by 3rd parties and sold to NV Energy). This number is converted to pounds / net megawatt hour (lbs / net MWh) and multiplied with the kWh usage.
|
NV Energy CO2e Intensity, 2021 |
||
|
Emissions Intensity Category |
Value |
Unit |
|
Total Owned + Purchased Generation (CO2e) Emissions Intensity (MT / Net MWh) |
0.331 |
MT / MWh |
|
1 metric ton to pounds conversion |
2204.62262 |
lbs |
|
Total Owned + Purchased Generation (CO2e) Emissions Intensity (lbs / Net MWh) |
729.7300872 |
lbs / MWh |
Natural gas use is reported in therms, and the inventory applies the following factor set, based on EPA guidance, to calculate associated emissions.
|
Natural Gas Emissions Factors |
|
|
Greenhouse Gas |
Emissions Factor (Kg / MMBTu) |
|
CO2 |
53.02 |
|
CH4 |
0.005 |
|
N2O |
0.0001 |
Other stationary fuels (eg, bottled gas, fuel oil, or wood) Some residents and businesses use other forms of stationary fuel, for energy. These types of fuel include bottled gas, fuel oil, or wood. Bottled gas includes bottled, tank, or liquefied petroleum (LP) gas, to include propane. Fuel oil includes kerosene. To determine the use of these stationary fuels in Washoe County, this inventory uses Nevada State Energy Data from the US Energy Information Administration (EIA) (e.g. Residential data).
|
2021 NV Statewide Stationary Energy Use (MMBtu / kWh)
(sources other than coal, natural gas, electricity, and renewable)
|
||||||
|
Sector |
Distillate Fuel Oil |
HGL |
Kerosene |
Motor Gasoline |
Residual Fuel Oil |
Wood |
|
Residential |
300,000 |
2,300,000 |
0 |
0 |
0 |
2,100,000 |
|
Commercial |
2,200,000 |
1,900,000 |
0 |
n/a |
0 |
400,000 |
|
Industrial |
17,400,000 |
800,000 |
0 |
2,300,000 |
0 |
100,000 |
Because this data is available at the state level, it must be downscaled from the Nevada population and economy to Washoe County’s population and economy. To determine the number of households using these kinds of fuel in Washoe County, this inventory uses the United States Census Bureau’s American Community Survey (ACS), segment S2504: Physical Housing Characteristics for Occupied Housing Units (5 year estimates). To determine the number of businesses using these kinds of fuel in Washoe County, this inventory uses The United States Census Bureau’s OnTheMap tool, to calculate Industrial and Commercial jobs by location. See Appendix 8 for a full list of jobs by category.
|
2021 Households, Commercial Jobs, and Industrial Jobs |
|||
|
Area |
Households |
Commercial Jobs |
Industrial Jobs |
|
Nevada |
1,141,952 |
923,779 |
287,028 |
|
Washoe County |
188,878 |
149,709 |
57,920 |
|
Washoe County % |
17% |
16% |
20% |
The inventory then applies the following factor set to these energy uses, based on EPA sources.
|
Emissions Factors: Other Stationary Fuels (kg / MMBtu) |
||||||
|
GHG |
Distillate Fuel Oil |
HGL |
Kerosene |
Motor Gasoline |
Residual Fuel Oil |
Wood (biogenic) |
|
CO2 |
73.96 |
62.98 |
n/a |
0.06683 |
n/a |
93.8 |
|
CH4 |
0.010870 |
0.010870 |
n/a |
0.000003 |
n/a |
0.316 |
|
N2O |
.00072464 |
0.0010870 |
n/a |
0.0000006 |
n/a |
0.0042 |
