E6. Solid Waste Inventory Results
0.13 MMT of CO2e | 2% of overall emissions
1. Solid Waste Summary
The Solid Waste sector causes 0.13 MMT of CO2e, or 2% of emissions in Washoe County. Most of the emissions (83%) come from actual waste generated, with the remainder coming from flaring of landfill gas. A very small amount of emissions comes from combustion of landfill gas, which generates energy that is sent back to the grid.
CO2e emissions from Solid Waste in Washoe County

|
MT CO2e by Activity for Solid Waste |
||
|
Activity |
MT CO2e |
Percent |
|
Waste generated |
130,466 |
100% |
|
Flaring of landfill gas |
28 |
0% |
|
Combustion of landfill gas |
.53 |
0% |
|
TOTAL |
130,495 |
100% |
Definition: Municipal Solid Waste (MSW) is waste collected by municipalities or other local authorities. MSW typically includes: food waste, garden and park waste, paper and cardboard, wood, textiles, disposable diapers, rubber and leather, plastics, metal, glass and other materials (e.g., ash, dirt dust, soil, electronic waste).
2. Solid Waste Management in Washoe County
Waste Management (WM) provides waste removal services for all of Washoe County, including Unincorporated areas, Reno, and Sparks. WM provides weekly curbside trash pick-up and bi-weekly curbside recycling pick-up for residents. Trash and recycling service is provided to businesses as needed. In 2024 WM reported 37,718 residential customers in Unincorporated Washoe County, 32,722 in the City of Sparks, and 72,592 in City of Reno. They also reported serving 493 businesses in Unincorporated Washoe County, 1,879 in the City of Sparks, and 4,987 in the City of Reno.
Most trash in Washoe County passes through one of WM’s three transfer stations: the Commercial Row Transfer Station (Reno), the Stead Transfer Station (Reno), or the Incline Village transfer station. The Commercial Row, Stead, and Incline Village transfer stations receive trash from 1) WM’s collection trucks, or 2) self-hauling customers.
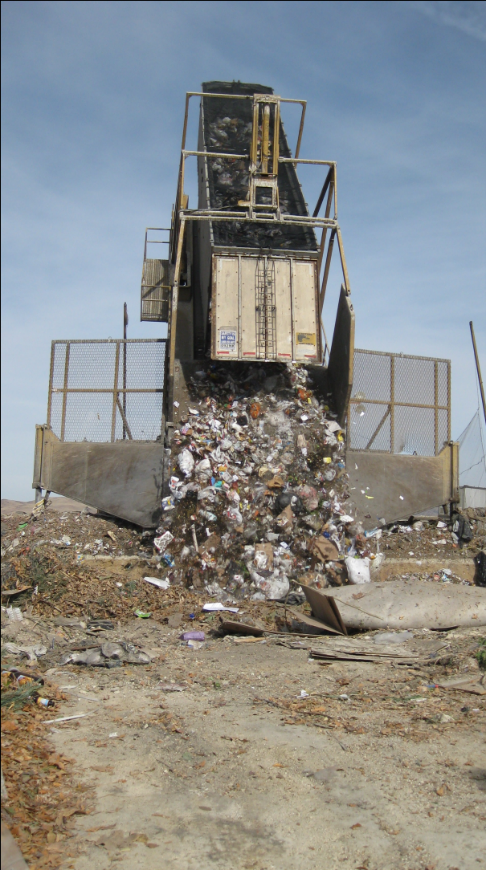
WM transfer trucks then take the trash to Lockwood Regional Landfill, a fully permitted class I municipal solid waste landfill located about 10 miles east of Reno in Storey County, Nevada. The site encompasses approximately 3,200 acres of open land with the landfill occupying approximately 555 acres. When transfer trucks filled with trash arrive at Lockwood Landfill, they pull onto a “tipper” which lifts the entire trailer dumping trash into an open cell (see Figure 10). Only one cell is active at a time. A compactor moves back and forth over the loose trash until it is tightly compacted and takes up the least amount of space possible. The trash is covered every evening with a layer of soil, alternative daily cover (inert material such as glass or chipped tires) and possibly a tarp. Covering the trash is required to reduce odors, discourage scavenging wildlife and reduce flies and other vectors from entering or escaping the material.

Figure 10 Tipper empties trash into Lockwood Landfill; image from WM
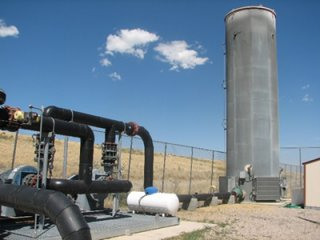
As the trash decomposes, it produces methane. This methane is collected in pipes so that it can be vented, burned, and used as an energy source. See Figure 11 for an example. Given Nevada’s arid climate, leachate (garbage juice) pooling in the landfill is uncommon. However, Lockwood has a natural clay liner that prevents seepage into groundwater. As the landfill is expanded, the lowest levels are built with a composite liner to contain any potential leachate or other unwanted material from escaping.

Figure 11 Example of an enclosed LFG flare, from EPA website
WM also collects recyclable materials from residents and businesses. Recyclable materials are taken to the Eco Center Material Recycling Facility (MRF) on E. Commercial Row in Reno for cleaning and sorting before being transported to a facility in Sacramento, California for a secondary sort. Paper, cardboard, tin, and plastic is baled to be sold as commodities. Glass collected in Northern Nevada is diverted from the Eco Center MRF to Lockwood Landfill where it is used as alternative daily cover. Because recycled items will be reused, no carbon emissions are associated with them, and they are not included in this inventory.
3. Solid Waste Emissions in Washoe County
Greenhouse gas emissions occur throughout the lifecycle of waste management.
Waste Generated First, the waste generated by a community creates emissions, regardless of where it is disposed. In 2021, Washoe County generated 300,775 tons of waste. When MSW is first deposited in a landfill, it undergoes an aerobic (with oxygen) decomposition stage when little methane is generated. Then, typically within less than 1 year, anaerobic conditions are established and methane-producing bacteria begin to decompose the waste and generate methane. The landfill methane collection scenario is important to calculations in this inventory because methane is a potent greenhouse gas at least 28 times more effective than CO₂ at trapping heat in the atmosphere over a 100-year period, per IPCC assessment report AR6. The landfill methane collection scenario at Lockwood is “typical,” per the table below.
|
Landfill methane collection scenario |
|||||
|
Scenario |
0% |
50% |
75% |
82.50% |
90% |
|
Worst-case |
Yrs 0 - 4 |
Yrs 5 – 9 |
Yrs 10 - 14 |
Years 15 to one year |
Final cover |
|
Typical |
Yrs 0 - 1 |
Yrs 2 - 4 |
Yrs 5 - 14 |
Years 15 to one year |
Final cover |
|
Aggressive |
Yr 0 |
Yrs .5 - 2 |
Yrs 3 - 14 |
Years 15 to one year |
Final cover |
|
California Regulatory |
Yr 0 |
Yr 1 |
Yrs 2 - 7 |
Years 8 to 1 year before final cover (85%) |
Final cover |
The wetter the landfill content, the more GHG emissions. The landfill moisture content at Lockwood is “dry,” with Storey County receiving 19 inches of rain per year, on average.
|
Precipitation Categories |
|
|
Category |
Annual inches |
|
Dry |
< 20 |
|
Moderate |
20 - 40 |
|
Wet |
> 40 |
To identify waste types in the landfill, this inventory uses data from a 2018 Waste Composition and Characterization Analysis of hand-sorted materials at WM transfer stations (Incline, Stead, and Sage) in spring and fall of 2018. Recyclable items are not pulled from transfer station waste as part of standard operating procedure.
|
2018 spring / fall waste characterization:
(Incline, Stead, and Sage transfer stations)
|
||||
|
148 Samples, Visual Sort |
Mean |
Standard Deviation |
Lower |
Upper |
|
1. Dry Recoverable Fiber |
11.9% |
14% |
10% |
14% |
|
2. PET |
1.3% |
1% |
1% |
1% |
|
3. HDPE |
.8% |
1% |
1% |
1% |
|
4. Film Plastic |
5.9% |
5% |
5% |
7% |
|
5. Mixed Plastics |
5.4% |
4% |
5% |
6% |
|
6. Glass |
2.5% |
5% |
2% |
3% |
|
7. Aluminum |
0.6% |
1% |
1% |
1% |
|
8. Mixed Ferrous (Tin & Salvage) |
2.2% |
3% |
2% |
3% |
|
9. Mixed Non‐Ferrous (Salvage) |
0.9% |
3% |
0% |
1% |
|
10. Inerts |
1.7% |
4% |
1% |
2% |
|
11. Hazardous Waste |
0.1% |
1% |
0% |
0% |
|
12. E‐Waste |
0.3% |
2% |
0% |
1% |
|
13. Textiles |
3.2% |
6% |
2% |
4% |
|
14. Organics |
55.7% |
21% |
53% |
59% |
|
a. Yard Waste |
15.3% |
19% |
13% |
18% |
|
b. Food Waste |
22.6% |
17% |
20% |
25% |
|
c. Clean Wood |
3.4% |
8% |
2% |
5% |
|
d. Treated/Painted Wood |
2.6% |
7% |
2% |
4% |
|
e. Wet/Contaminated Fiber |
10.9% |
8% |
10% |
12% |
|
f. Rubber |
0.2% |
1% |
0% |
0% |
|
g. Allocated Organics |
0.6% |
5% |
0% |
1% |
|
15. Fines (<2” Items) |
1.6% |
4% |
1% |
2% |
|
16. Other |
6.1% |
11% |
5% |
8% |
The data shows that 67.6% of material thrown in the trash is “Organics” (55.7%) or “Dry Recoverable Fiber” (11.9%). Dry Recoverable Fiber is defined as “All clean dry fiber, including cardboard (old corrugated cardboard), chip board (cereal / shoe box), office paper, junk mail, and shredded paper that is readily recoverable using current waste / recycling processing technology.” Definitions for all categories are listed in Appendix 9.
Organic materials cause greenhouse gas emissions, and the inventory calculates emissions for those items only. The Waste Characterization categories do not exactly match Clearpath categories, so they are instead mapped as follows. Rubber (0.2%) and Allocated Organics (0.6%) are not included in the calculation.
|
Mapping to Clearpath from Waste Characterization |
||
|
Clearpath Waste Type |
Inventory % |
Relationship to Waste Characterization |
|
Newspaper |
0.0% |
Not in “fiber” definitions |
|
Office Paper |
7.6% |
One third of 22.8% dry + wet fiber |
|
Corrugated Cardboard |
7.6% |
One third of 22.8% dry + wet fiber |
|
Magazines / Third Class Mail |
7.6% |
One third of 22.8% dry + wet fiber |
|
Food Scraps |
22.6% |
Full “food waste” number |
|
Grass |
5.10% |
One third of 15.3% yard waste |
|
Leaves |
5.10% |
One third of 15.3% yard waste |
|
Branches |
5.10% |
One third of 15.3% yard waste |
|
Dimensional Lumber |
6.0% |
Sum of clean and treated / painted wood |
|
TOTAL |
66.7% |
|
The Inventory then applies a factor set from EPA’s WARM (Waste Reduction Model) tool, version 15.
|
2021 Factor Set for Waste (MT CH₄ / wet short ton) |
|
|
Waste Type |
Factor |
|
Newspaper |
0.0420 |
|
Office Paper |
0.1556 |
|
Corrugated Cardboard |
0.1048 |
|
Magazines / Third Class Mail |
0.0476 |
|
Food Scraps |
0.0648 |
|
Grass |
0.0228 |
|
Leaves |
0.0260 |
|
Branches |
0.0580 |
|
Dimensional Lumber |
0.0068 |
Combustion and flaring of landfill gas Next, the disposal of landfill gases causes emissions. In a typical landfill operation, landfill gas (LFG) is extracted from landfills using a series of wells and a blower / flare (or vacuum) system. The image in Figure 12 shows a technician checking a gas well at Lockwood landfill. This system directs the collected gas to a central point where it can be processed and treated depending upon the ultimate use for the gas. From this point, the gas can be flared or beneficially used in an LFG energy project. Lockwood Landfill emits 1,652,673,700 cubic feet / year of landfill gas. Since 28% of waste in the landfill comes from Washoe County, ~642,309,095 cubic feet / year are related to Washoe County Operations. Of that gas, 41% (261,858,830 cubic feet / year) is flared, and 59% (380,450,265 cubic feet / year) is combusted to generate grid electricity. Methane (CH₄) makes up 52% of the landfill gas, and 99.96% of that methane is destroyed in this process. The inventory applies standard emissions factors to the small remainder of methane as well as the flared gas.

Figure 12 A technician checks a gas well at Lockwood landfill. (WM photo)
